Conditional Formatting
Conditional formatting automatically changes the appearance of cells based on their values or formulas, making it easy to highlight trends, outliers, and patterns at a glance.
Opening the Conditional Formatting Drawer
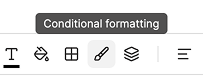
Click the Conditional Formatting button in the toolbar.
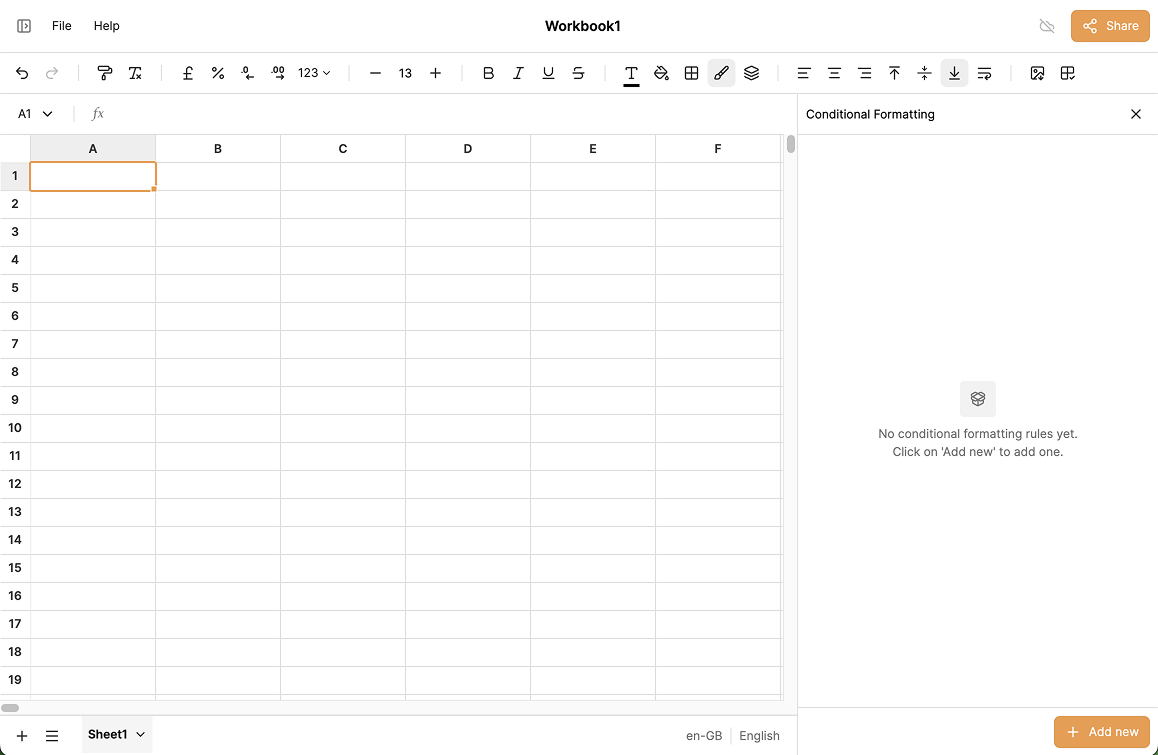
A drawer opens on the right side of the screen. New workbooks start with no rules; click Add new to create your first one.
Setting the Range
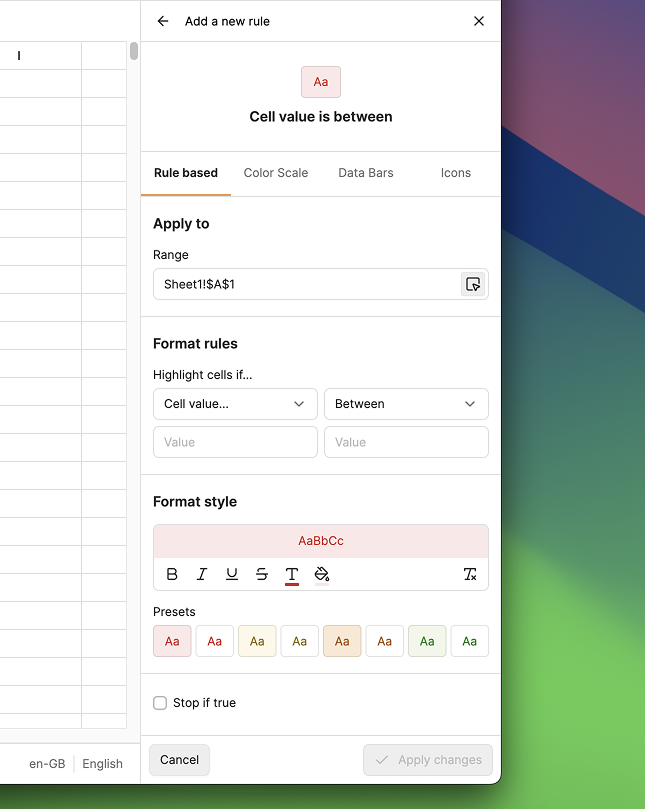
Every rule has an Apply to section at the top where you specify the cell range the rule applies to. You can type a range directly, or click Use selected range to fill it from your current selection.
Rule Types
IronCalc supports four types of conditional formatting rules:
1. Rule Based
Format cells that match a condition. Choose a criteria type (Cell value, Text, Date, Formula, Duplicate values, and more) then refine it with an operator such as between, greater than, equal to, etc.
You can then pick a style to apply when the condition is met. Clicking one of the style presets will overwrite the custom style above it.
Enable Stop if true to prevent lower-priority rules from being evaluated when this rule matches.
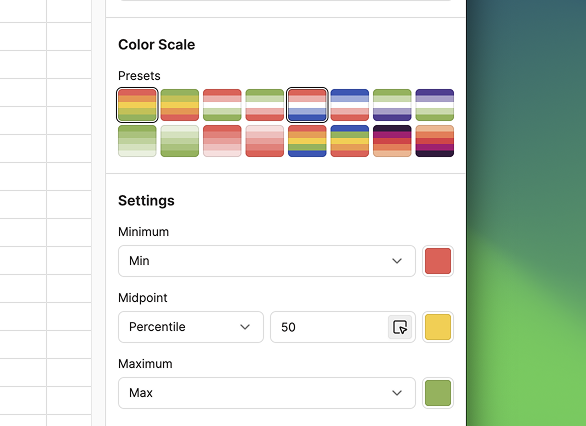
2. Color Scale
Color scales apply a gradient fill to cells based on their relative values within the range. Choose from the built-in presets, or build a custom scale by setting the minimum, midpoint, and maximum values and assigning a color to each stop. To use a two-color scale instead of three, set the midpoint to None.
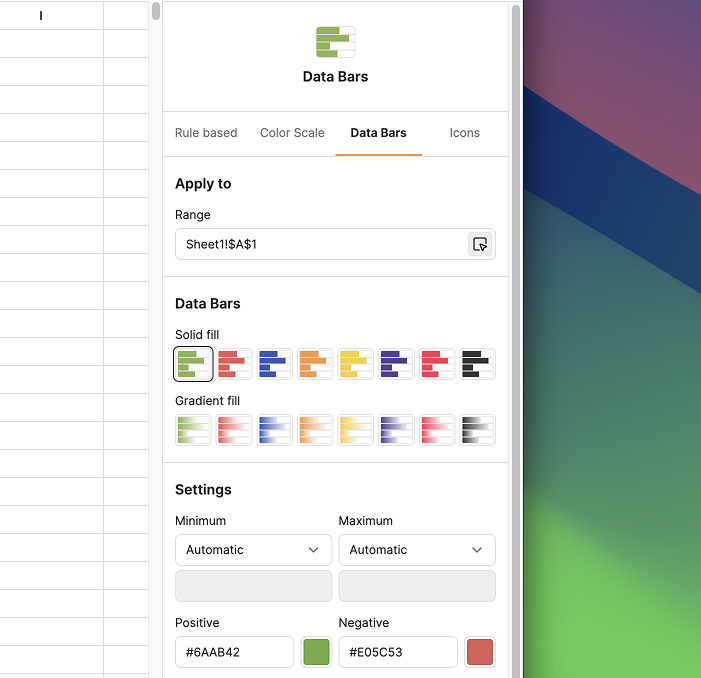
3. Data Bars
Data bars fill each cell with a bar whose length reflects the cell's value relative to the range, giving you an instant in-cell bar chart. IronCalc offers eight presets in solid or gradient styles.
In the settings you can:
- Leave the minimum and maximum as Auto, or set explicit numeric values.
- Edit the colors for both positive and negative bars independently.
- Hide the cell value so only the bar is shown.
4. Icons
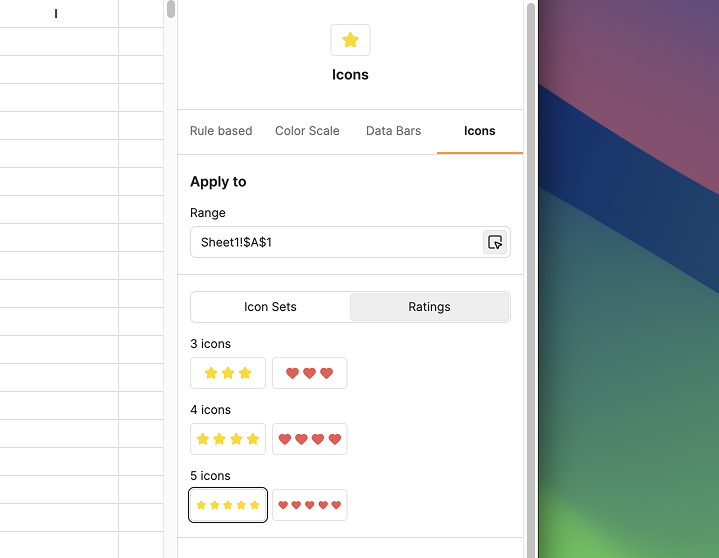
Icons display a small symbol inside each cell based on its value. IronCalc provides two icon modes:
Icon Sets
Each cell receives one icon from a set of 2–5 variations. IronCalc includes several presets; in the settings you can change both the logic (the thresholds that determine which icon to show) and the icon and color for each stop.
Ratings
Ratings repeat an icon multiple times to represent a value, similar to a star-rating display. Sets can range from 3 to 5 repetitions, making them well suited for 1–5 scale data where a single icon per cell would lose information. Presets are available, and the logic, icon, and color are all editable.
For both modes, you can hide the cell value so only the icons are shown.